CoMet Toolkit vs. Atmospheric Weather Balloons
 Image credit: Unsplash
🎈 Background
Global Climate Observing System (GCOS) ensures access to long-term climate observations. Within GCOS, the GCOS Reference Upper-Air Network (GRUAN) plays a key role by providing reference-quality atmospheric balloon data.
GRUAN data includes measurements such as temperature, humidity and pressure. This data is traceable to SI standards, and published with detailed uncertainty and metadata. At present, GRUAN does not report detailed error correlation across its data products.
This article outlines a study which has successfully deployed CoMet Toolkit to acquire covariance information of GRUAN data.
🗸 Aims
- Investigate GRUAN data product uncertainty components.
- Obtain covariance matrices for temperature (T) and relative humidity (RH).
- Assess how different data processing strategies impact covariance.
📋 Data
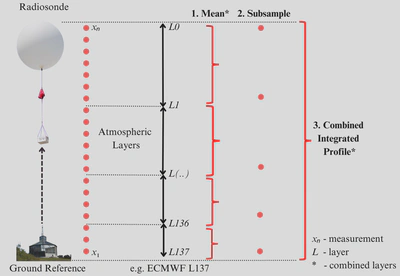
GRUAN data is gathered via radiosondes mounted on weather balloons, recording vertical atmospheric profiles at high resolution (1–2 seconds per point) reaching altitudes of 30–35 km.
We selected two radiosonde launches from Lindenberg, Germany (GRUAN’s lead centre) on January 1st, 2024 at 00:00 and 12:00 UTC. The data is available in NetCDF format, and includes full metadata and GRUAN-validated uncertainty components.
Each balloon ascent collects thousands of measurements. To reduce the number of data points, this data is typically layered. For instance, 137-layer ECMWF pressure coordinate system, is commonly used in atmospheric modelling.
🗸 Uncertainties
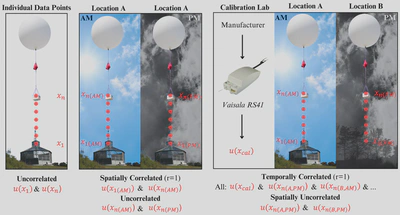
For each measurement point, GRUAN reports the combined uncertainty as well as three uncertainty components:
- Uncorrelated: random, no relationship between points exists.
- Spatially Correlated: data within a single vertical profile is spatially related
- Temporally Correlated: data across different soundings and/or sites is temporally related (e.g., due to shared calibration).
GRUAN assumes full (r = 1) correlation for spatial and temporal components—an important simplification carried into the analysis.
☄️CoMet Setup
Covariance and correlation matrices were calculated using CoMet.
obsarray: used to re-structure weather balloon measurements, their uncertainty, and metadata (units, dimensions)comet_maths: performed the mathematical operations to compute covariance matrices, correlation information
🗂️ Results
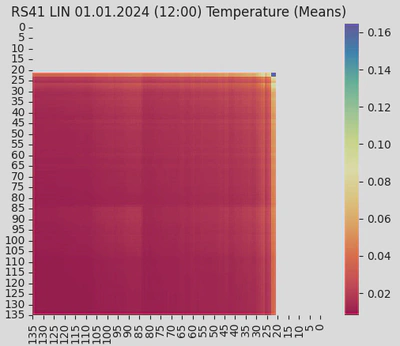
Using CoMet, raw covariance matrices were computed from the unprocessed midday profile.
- Temperature and RH matrices show strong diagonals (variance) and structured off-diagonal patterns (systematic uncertainty).
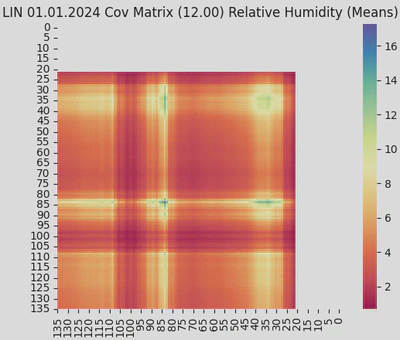
- The RH covariance scale is notably higher, especially due to sensitivity to solar radiation during daytime launches.
In layered heatmaps:
- White regions indicate missing data beyond balloon burst.
- Mean-layered data shows reduced variance (weaker diagonal).
- Subsampled data retains more variance but still shows strong off-diagonal structure due to full assumed correlation.
Notably, the Upper Troposphere–Lower Stratosphere (UTLS) region exhibits distinct covariance patterns.
🗸 Layered Relative Humidity Covariance
Layered RH matrices differ significantly:
- Covariance values are up to 100× greater than for temperature.
- Heatmaps show a checkerboard pattern, indicating high inter-layer correlation.
- Averaging reduces the variance, and temporal correlations dominate the structure, reflecting RH’s rapid environmental sensitivity.
These findings underscore the need to treat RH and temperature differently in uncertainty-aware models.
🗸 Summary of Findings
This project:
- Developed and validated a method for computing covariance matrices from GRUAN RS-41 data using CoMet,
- Tested multiple data processing strategies (mean, subsample, integration),
- Provided practical recommendations through a GRUAN Technical Note.
The results help researchers better account for correlated uncertainty when working with radiosonde data.
🗸 Future Work
Planned next steps include:
- Incorporating Tier 2 uncertainty sources,
- Implementing partial correlation handling,
- Expanding to other variables (e.g., pressure, wind, radiation).
These developments will enhance climate models’ treatment of uncertainty and ensure even greater accuracy in long-term climate monitoring.